Bitcoin Golden Cross Explained
There have been many reports recently pointing out early signs of a Bitcoin bull run. Some also call this the “Bitcoin golden cross” phenomenon. If you’re relatively new to crypto and trading, you might not know what a golden cross is.
So, in this quick article, we will explain everything you need to know about the golden cross phenomenon and why people are anticipating a Bitcoin bull run.
What is the Golden Cross
A golden cross is a candlestick chart pattern that signals a near-future rally in prices, meaning it’s a bullish sign. To understand how it works, first, we must understand what moving averages (MA) mean. For the sake of simplicity, a moving average means the average price of a stock in a given timeframe. In the context of crypto, it’s the average price of a particular coin in a given timeframe.
Now back to what a golden cross is. A golden cross occurs when a shorter-term moving average crosses over a longer-term moving average, meaning the short-term average price crosses over the long-term average price of a cryptocurrency.
Although there are many different moving averages in the trading world, the most commonly used are the 50-period (shorter-term MA) and the 200-period (longer-term MA), where “period” could represent anything from hours, days, weeks, etc. This is considered to be the most reliable moving average to determine if the market is going up. Some traders may even factor in the trading volume, along with the golden cross, for more reliability, as high trading volume is also a bullish sign.
Stages of a Golden Cross
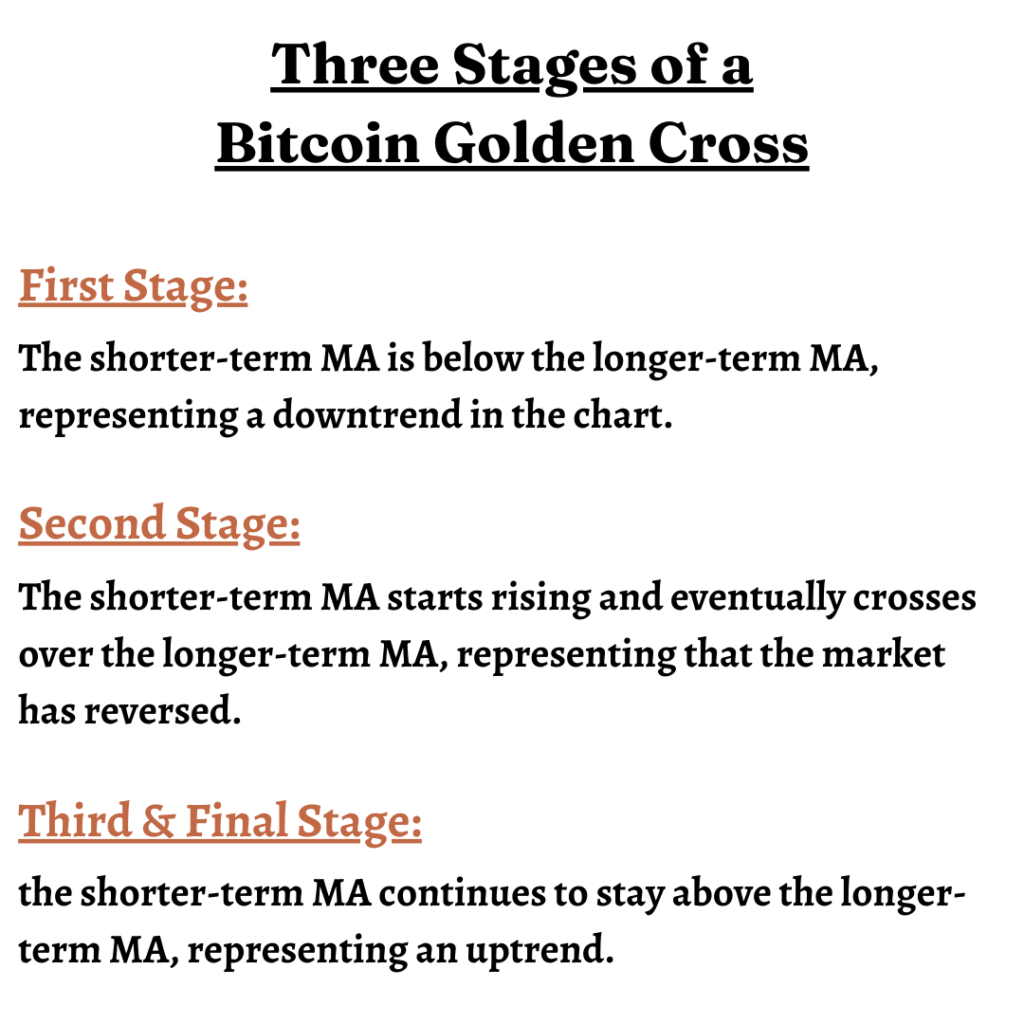
Now to put everything into context, let’s see how the golden cross actually occurs. A golden cross typically occurs in three stages –
In the first stage, the shorter-term moving average is below the longer-term moving average, representing a downtrend in the chart.
In the second stage, the shorter-term moving average starts rising and eventually crosses over the longer-term moving average, representing that the market has reversed.
In the third and final stage, the shorter-term moving average continues to stay above the longer-term moving average, representing an uptrend, which is when the golden cross is confirmed.
As a general rule of thumb, higher-timeframe signals are a much stronger indicator than lower-timeframe signals. For example, a daily chart pattern showing signs of a golden cross is much more reliable than that of an hourly chart pattern. However, it’s important to note that sometimes, a golden cross may produce false signals, in which case, even the higher-timeframe signals are not reliable.
A golden cross is typically a good sign for traders and investors as their gains go up with prices. But with that, crypto holders must also consider the tax implications, which many people often overlook. Bitcoin.Tax is an online crypto tax software that will help calculate your taxes, produce the data and forms you need to file your taxes, and so much more.
Early Signs of a Bitcoin Golden Cross
In the last few weeks, there have been trends signaling a possible Bitcoin bull run. Glassnode, a blockchain analytics platform, recently reported a golden cross event between the 30-day and 60-day moving averages. We have spotted similar trends in the past, before a surge in Bitcoin prices in January 2019 and multiple occurrences in 2020.
As of now, the crypto community’s views are split on whether there’ll be another bull run or not. However, all evidence points towards a potential bull run. Until then, you’ll have to keep an eye out for everything happening in the crypto space. We’ll be sure to continue following the Bitcoin market trends and sharing them with our readers!