Fundamental Analysis of Cryptocurrency – How Reliable is it?
As a trader or investor, the fundamental analysis of cryptocurrency is one of the best tools at your disposal to evaluate the real value of a crypto asset.
The entire purpose of analysis, whether technical or fundamental, is to find out if a particular crypto is overvalued or undervalued, so you can bet on its future prices.
While technical analysis looks at price charts and candlesticks to evaluate historical patterns and price fluctuations to predict the future, fundamental analysis looks at the underlying value of a crypto – its utility, tokenomics, trading volume, liquidity, etc.
In this guide, we’ll explain everything you need to know about the fundamental analysis of cryptocurrencies
What is Fundamental Analysis?
In traditional terms, fundamental analysis is a method or tool to measure the true intrinsic value of an asset.
Initially, this method was introduced to evaluate the value of stocks and securities. But as more time passed, traders and investors started using it to measure alternative assets like cryptocurrency.
Fundamental analysis of cryptocurrency isn’t entirely the same as fundamental analysis of stocks and securities.
However, though the metrics and indicators differ, the overarching ideas and concepts are still pretty much the same.
Drawbacks of Fundamental Analysis of Cryptocurrency
Solely relying on fundamental analysis isn’t a good idea.
Why?
As discussed before, fundamental analysis was originally created for stocks and securities. Therefore, you can’t rely on it 100% to interpret the future prices of cryptocurrencies.
It’s a great tool in terms of long-term investment strategies. But for short-term investment and trading practices like scalping, swing trading or day trading, you need to combine fundamental analysis with technical analysis.
In fact, you might have to rely on the technicals more than the fundamentals.
Metrics of Fundamental Analysis of Cryptocurrency
The following is a non-exhaustive list of metrics for the fundamental analysis of cryptocurrency. They are roughly divided into four categories – on-chain metrics, project metrics, financial metrics and other metrics.
On-Chain Metrics
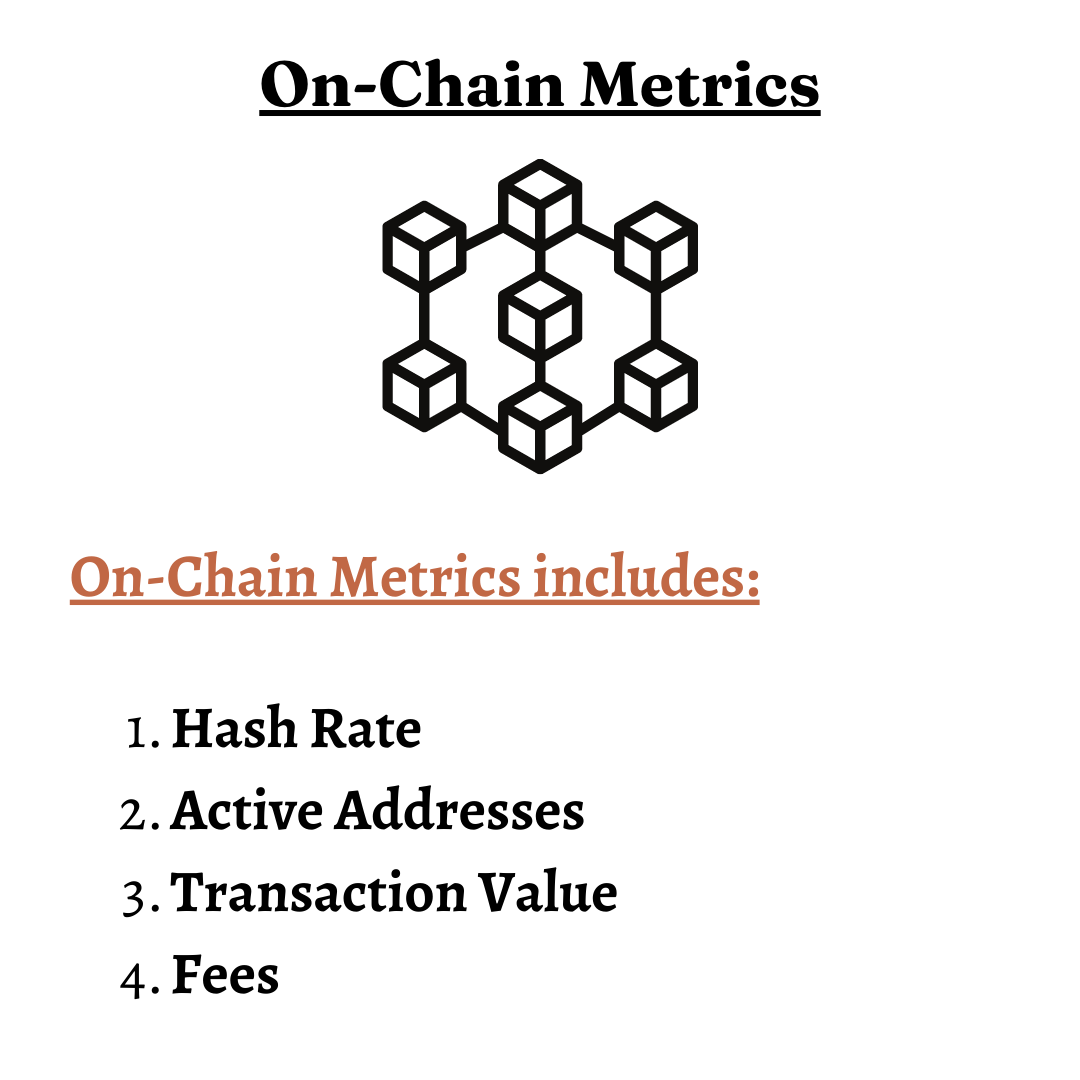
On-chain metrics consist of data and numbers pulled directly from the blockchain itself. We can pull these data ourselves or use a tool to do it for us. Fortunately, most crypto exchanges already provide abundant data for all the listed cryptocurrencies.
Nonetheless, here are some on-chain metrics you should look out for when doing your fundamental analysis.
Hash Rates
What is the hash rate?
It’s the combined computational power used for mining any particular cryptocurrency.
Though we never know the actual hash rate, we can get pretty good approximates based on publicly available data.
What does the hash rate indicate?
A higher hash rate indicates that there is more incentive for miners to mine, which means more miners will join the network, thus making it more secure.
Conversely, low hash rates indicate a loss of interest from the investors’ side, which will force miners to leave the network, thus making it less secure and stable.
Active Addresses
What are active addresses?
It’s the number of active blockchain addresses. In other words, it’s the sum of the total number of sender and receiver addresses.
Analyzing this over days, weeks and months can help us gauge the overall activity of the network and help us identify if it’s growing or declining.
However, it’s quite easy to manipulate these numbers, so be cautious.
Transaction Value
You can’t rely on the active addresses alone. You must also measure the total transaction value, meaning how much value is being traded every day.
It’ll help you gauge whether the transaction value of a particular crypto is growing, declining or too volatile and unpredictable.
Fees
Most cryptocurrencies mainly work on either one of these two mining mechanisms – Proof of Work (PoW) or Proof of Stake (PoS).
In both mining methods, the network charges a certain amount of fees for the miners to validate blocks of transactions.
It’s similar to bidding – whoever pays the most gets their block validated first.
You might’ve heard about Ethereum’s gas fee. It’s the same thing.
So, high fees in a network is generally a good indicator of a higher number of transactions taking place in a network.
Project Metrics
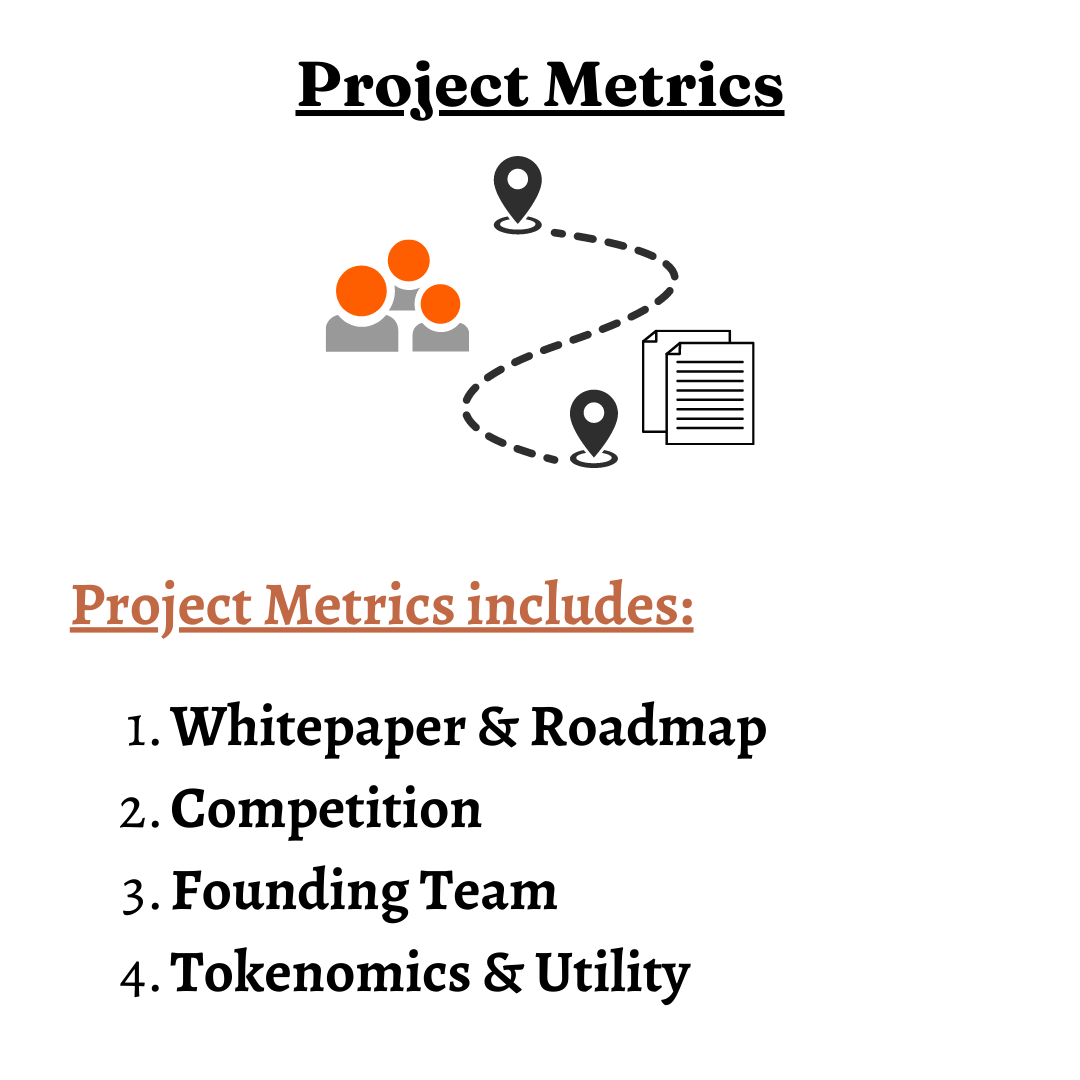
While the on-chain metrics are based on raw data and numbers, project metrics are more of a qualitative assessment of the cryptocurrency based on its founders, whitepaper, competition and the utility it offers.
Whitepaper and Roadmap
The whitepaper is the most important piece of document to understand how the cryptocurrency works, what utility it offers and its future potential.
A whitepaper is a technical document, sometimes too technical, that outlines everything you need to know about the project. Though there’s a lot to unpack, here are some key factors you should look out for –
- The technology behind it. Is it open source? What mining consensus does it use? And more.
- The use cases it aims to cater to.
- The supply and distribution mechanism of the coin.
- Future upgrades and features.
Along with the whitepaper, you also wanna look out for the roadmap. Usually, you can find the roadmap on the official website.
The roadmap outlines the goals and objectives, along with a timeline, of a project going forward.
Competition
After reading the whitepaper, you might think that the project has great potential based on the technology, utility, and roadmap.
However, when you compare it to other projects and competitors in the market, you might realize that they have already been outdone.
So, you should always analyze the competition. And competition doesn’t only include other crypto projects but already established systems and infrastructure that the project aims to replace or become an alternative for.
Founding Team
We talk about the importance of doing your research on the founding team in the guide to flip NFTs as well.
The founding team of any project is one of the best qualitative indicators for its future performance.
Do a background check on the founding team members of the projects. Find out their background, expertise, past work history and accomplishment.
Check out their social media. Listen to what other people are saying about them.
Is there anything shady about the founders? There are thousands of rug pulls created every day. A good look at the founding team can help you avoid many scams.
On the other hand, a team consisting of talented members with a proven track record of consistent success is more likely to continue creating more successful projects.
Tokenomics and Utility
What is tokenomics?
It refers to the economy of supply and demand of the token. Higher the demand relative to supply, the higher the price and vice versa. It also includes the crypto’s incentive structure to drive its price up.
Tokenomics is intertwined with utility.
What is utility?
It refers to the use cases or applications of a particular coin or token.
For the most part, the better the utility, the better the tokenomics.
In some cases, you might also have to consider if the utility is something the larger audience will recognize. If yes, how fast?
Financial Metrics
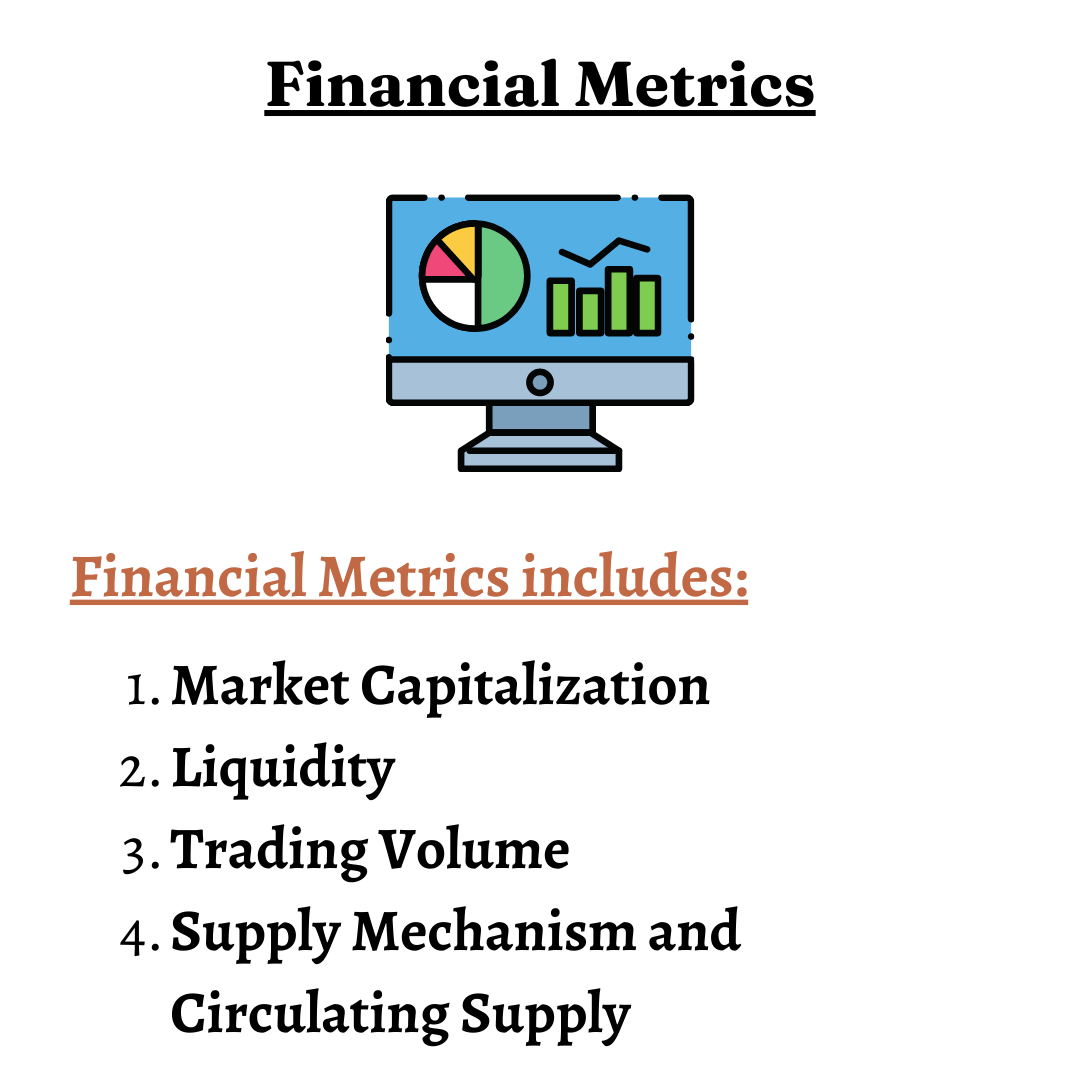
Unlike project metrics, financial metrics take more of a quantitative approach to assess the value of a cryptocurrency. It focuses more on the trades being made, liquidity, market cap, etc.
Market Capitalization
How do you calculate market capitalization?
Multiply the current price of a coin with the total number of circulating coins, and you’ll get market capitalization. It helps us find a rough estimation of the network value.
You don’t actually have to do the calculation yourself. CoinMarketCap is a great tool to get the market cap for any cryptocurrency.
A high market cap indicates a sturdy infrastructure and long-term stability but less space for growth.
A low market cap indicates the opposite – less stability but more space for growth.
However, there are fundamental flaws in the calculation of market cap, like not considering lost wallets, lost keys and stolen coins. Apart from that, it’s also quite easy to manipulate these numbers.
That’s why you can’t entirely rely on them.
Liquidity
Liquidity is crucial for any asset, not just crypto.
Higher liquidity indicates higher demand, which means you can easily sell off your crypto anytime you want at the fair market value.
Less liquidity indicates less demand, which means you either have to wait till demand increases again to sell it at a fair market value or lower your price if you don’t wanna wait.
Ideally, you wanna invest in crypto that has high liquidity, so you can exit the market whenever you want without losing money.
Trading Volume
Trading volume and liquidity go hand in hand.
Higher trading volume indicates higher liquidity, mostly.
Ideally, you wanna look for an uptrend in price backed by high trading volume. That’s an indicator of a stable and healthy-growing cryptocurrency.
Supply Mechanism and Circulating Supply
Understanding the supply mechanism of the coin is essential.
Some coins like Bitcoin have a cap on maximum supply. Some coins reduce supply over time, while others periodically burn their coins to create more scarcity.
Basically, different cryptocurrencies have different supply and distribution mechanisms. Some work better than others, given certain conditions.
Circulating supply is the number of coins in active circulation.
Other Metrics
These metrics are not as easy to measure as some of the other metrics mentioned. But veterans who have been trading for a long time can easily read off of these signs and predict future prices pretty accurately.
Socio Political Environment
On a global level, something like a pandemic, war or a significant country like China banning crypto can all affect the market tremendously and has done in the past.
On a national level, regulations, political unrest, and the overall economic condition of a country can affect the prices.
As we said before, it’s difficult to measure exactly how much of an impact it would have on crypto prices, but experienced traders can predict with a greater probability how the market is going to react to different stimuli.
User Behavior
User behavior refers to how the market is going to react to FUD and FOMO.
FUD stands for fear, uncertainty and doubt. It usually drives people to sell off their crypto, indicating a bearish trend.
FOMO stands for fear of missing out and it’s the number one reason why many people lose money.
Indicators of Fundamental Analysis of Cryptocurrency

We’ve already touched upon this subject several times throughout the article.
Metrics alone are not enough for doing a fundamental analysis of cryptocurrency.
It’s how different metrics measure up against or relative to each other that gives us a more solid indication of the intrinsic value of an asset.
For example, reading the whitepaper alone will only let you see half the picture. It’s only when you compare it to the competitors that you’ll get a better understanding of its value and position in the market.
The following are some of the most popular and most used indicators when doing a fundamental analysis of cryptocurrency.
Network Value to Transactions Ratio (NVT)
How to calculate the network value to transaction ratio (NVT)?
Divide the market cap by daily transaction count, and you’ll get your NVT ratio.
A high market cap with a low daily transaction count indicates that the asset is overvalued, while a low market cap with a high transaction count indicates it’s undervalued.
After finding out whether the crypto is overvalued or undervalued, you can choose to long or short crypto.
Stock-to-Flow Ratio
How to calculate the stock-to-flow ratio?
Divide the total circulating supply of the crypto by coins produced per year, and you’ll get your stock-to-flow ratio.
It typically works on assets with a limited supply like Bitcoin. The number of new Bitcoins produced every year gets lesser and lesser, making it more and more scarce, therefore, more valuable.
Though the stock-to-flow ratio is a pretty good indicator for fundamental analysis of cryptocurrencies, it has its own flaws and loopholes that you should look out for.
Tools for Fundamental Analysis of Cryptocurrency
Doing fundamental analysis all by yourself is not only unproductive but unintelligent, especially when you have these useful tools at your disposal.
CoinMarketCap
It’s one of the best free tools to get loads of data, stats and numbers for metrics we listed in this article.
Baserank
This website has contributing experts that do the fundamental analysis for you, and based on it, provides a review and score for every new project.
It has a free subscription as well as a paid subscription.
Glassnode Studio
The best tool for pulling out data for on-chain metrics. Everything you need in one place.
Along with on-chain metrics, this tool also offers many technical analysis tools. So, it’s perfect for traders and investors who wanna combine fundamental analysis with technical analysis.